December 09, 2025
Mount Erebus in Antarctica stands out for several extraordinary features: it is the southernmost active volcano, it hosts more than 100 ice fumaroles, and it releases roughly 80 grams of gold vapor into the atmosphere each day. While the idea of harvesting gold from a volcano’s plume is more fantasy than feasible, the anecdote underscores a broader reality - in a world where gold’s value is surging, investors are searching for every possible source of the metal. That search has become far more urgent in 2025, as gold prices have accelerated sharply and global demand has reached multi-year highs.
2025 has been memorable for investors in precious metals. Silver surpassed its all-time high set in 2011, and gold delivered a staggering 60.52% return since the start of the year.1 This remarkable rally is driven by a variety of factors, including geopolitical uncertainty, a weaker U.S. dollar, and central bank and investor demand. The rally has left many investors rethinking gold’s value and its potential place in a portfolio.
The gold supply comes from two sources: mined gold and recycled gold. Recycled gold (melted down and reused) made up about 26% of global supply in 2025, with the remaining 74% produced by mines.2 A tonne of gold is a metric ton (1,000 kilograms), the standard unit in the precious metals market. Leading producers include China (380 tonnes), Russia (330 tonnes), Australia (284 tonnes), Canada (202 tonnes), and the U.S. (158 tonnes).3
To help visualize global gold supply, it’s useful to note that all the gold ever mined would form a cube only 22 × 22 × 22 meters. The entire world’s above-ground gold could fit inside a single building-sized cube, roughly the height of a seven-story structure.4 The small volume often surprises people and underscores gold’s enduring scarcity.
Current estimates suggest that humanity has mined approximately 216,265 tonnes of gold to date. Below the surface, an estimated 132,000 tonnes of gold resources remain.5 Of that total, about 55,000 tonnes are classified as reserves, which means gold that can be economically extracted at today’s prices. As prices rise, some portion of the remaining resources becomes profitable to mine and shifts into the reserve category. In addition to these long-term estimates, global mines produced roughly 2,700 tonnes of new gold in the first three quarters of 2025 alone.
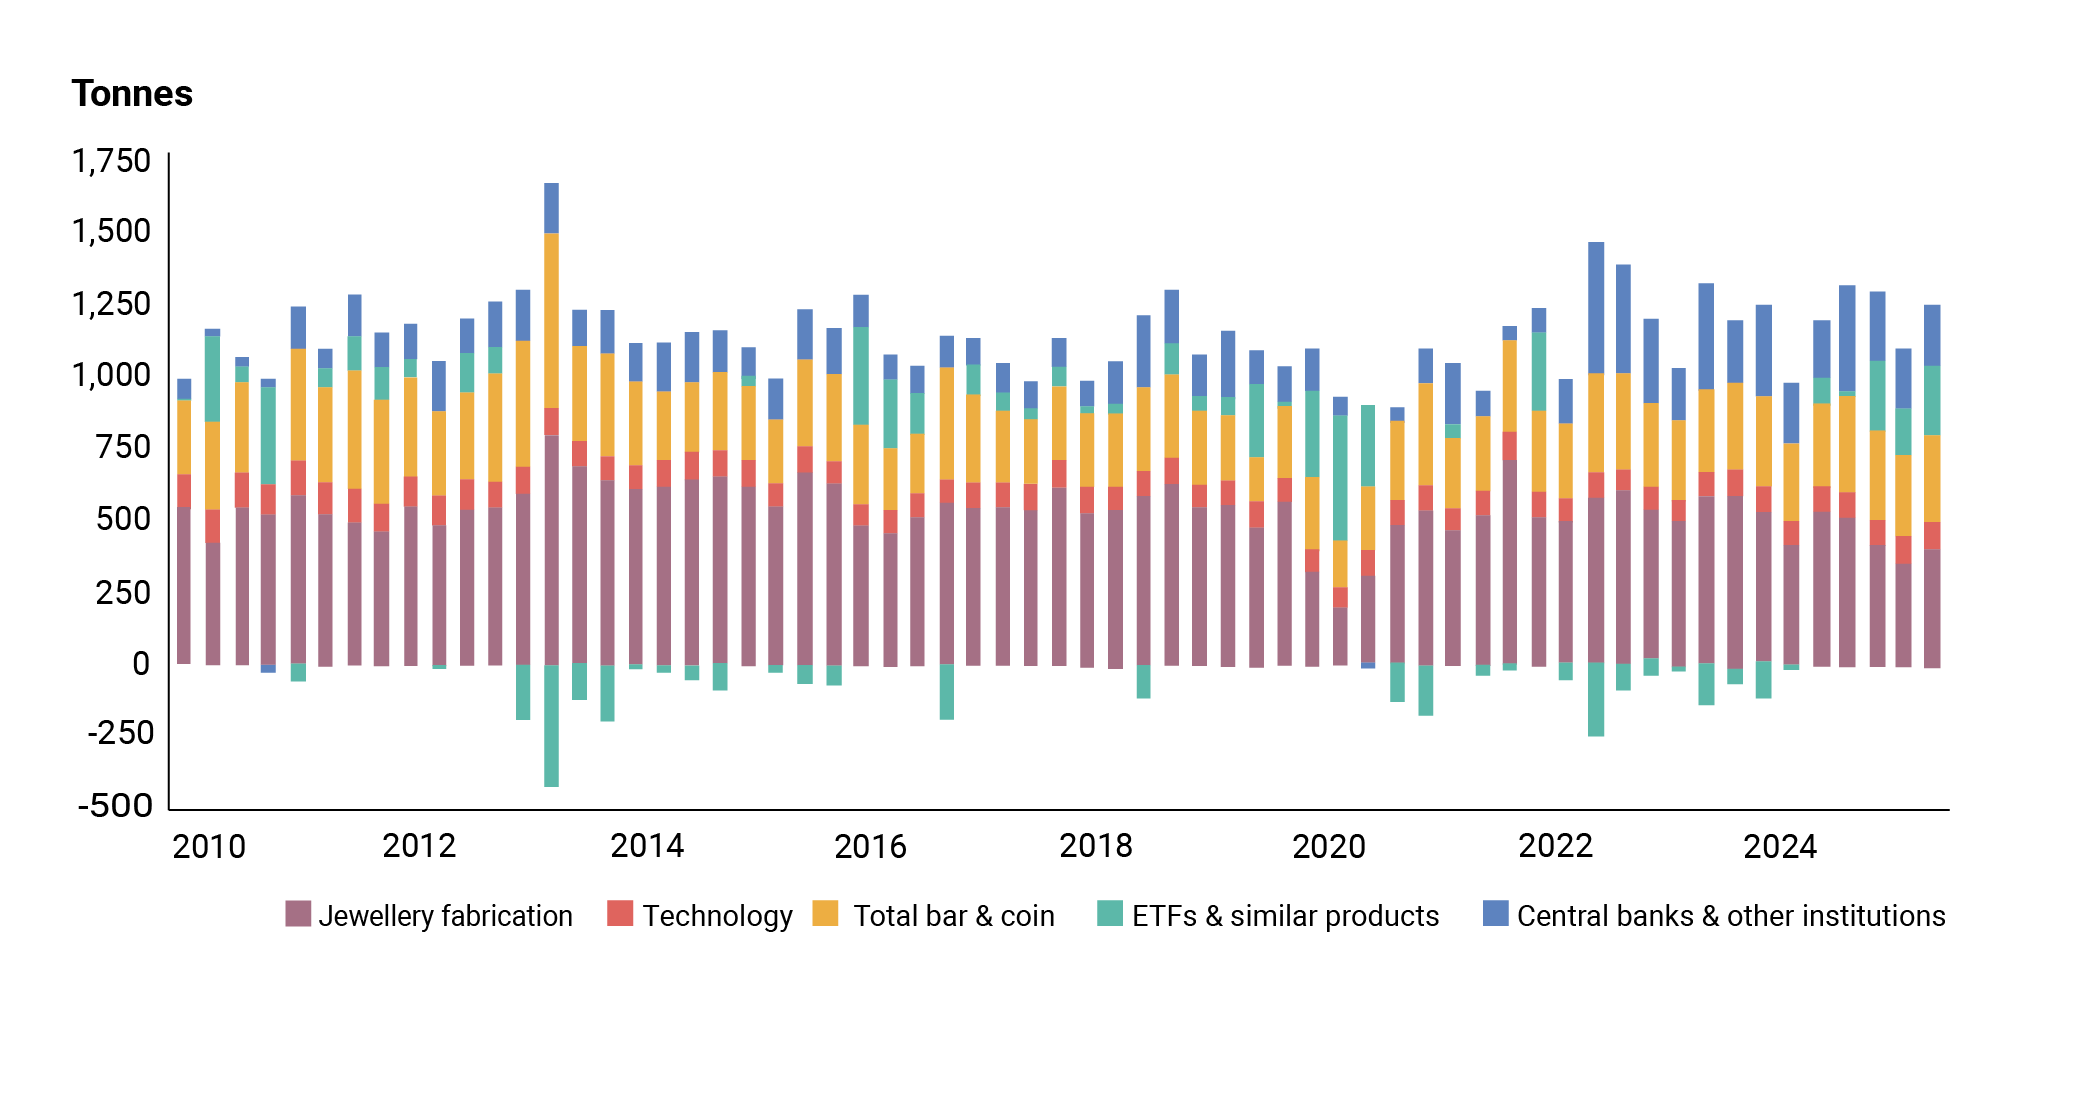
Chart Sources: ICE Benchmark Administration, Metals Focus, World Gold Council
*Data as of 30 September 2025.
While gold supply shifts with price and extraction economics, demand is equally varied. Technology accounts for about 6% of global demand, where gold’s conductivity and corrosion resistance make it useful in components such as circuit boards and microchips.6 In healthcare, gold remains important in applications ranging from dental work to diagnostic tests. Jewelry is still the most enduring source of demand, representing roughly 32% of global purchases as of Q3 2025. The recent surge in gold prices, however, has been driven far more by central banks and investors.
Central bank demand has risen sharply since 2022 as policymakers sought reserve assets that diversify away from the U.S. dollar and avoid counterparty risk, meaning gold’s value does not depend on another institution’s ability to meet its obligations. Periods of high inflation and low or negative real interest rates make holding gold more attractive, since the opportunity cost of owning a non-yielding asset declines. In 2020, central banks bought 254.95 tonnes of gold, and over the last four quarters that figure has nearly quadrupled to 998.64 tonnes, representing almost 17% of global demand in Q3.7
Investors have added to the momentum. Much of the increase reflects the “debasement trade,” a bet on a weaker U.S. dollar boosting dollar-denominated assets like gold. While demand for physical bars and coins has risen, a large share of 2025’s rally comes from inflows into gold exchange-traded funds (ETFs). ETF demand is up 134% from the same period last year, and by September more than 40% of total gold demand came from investors through coins, bars, and ETFs.8
Most investors purchase gold for three primary reasons: potential returns, diversification, and inflation protection. Starting with returns, gold has delivered a compound annual growth rate of 6.15% over the past 40 years.8 While that figure is far from insignificant, it does trail U.S. equities by a wide margin. What’s more concerning today is the magnitude of gold’s three-year, 120% surge. Over those same four decades, there have been 10 instances in which gold climbed more than 100% over a three-year period. In each of those cases, the following decade produced an average annual return of just 2.65%. If this history is any guide, the forward-looking return for gold may fall well below its long-term average.
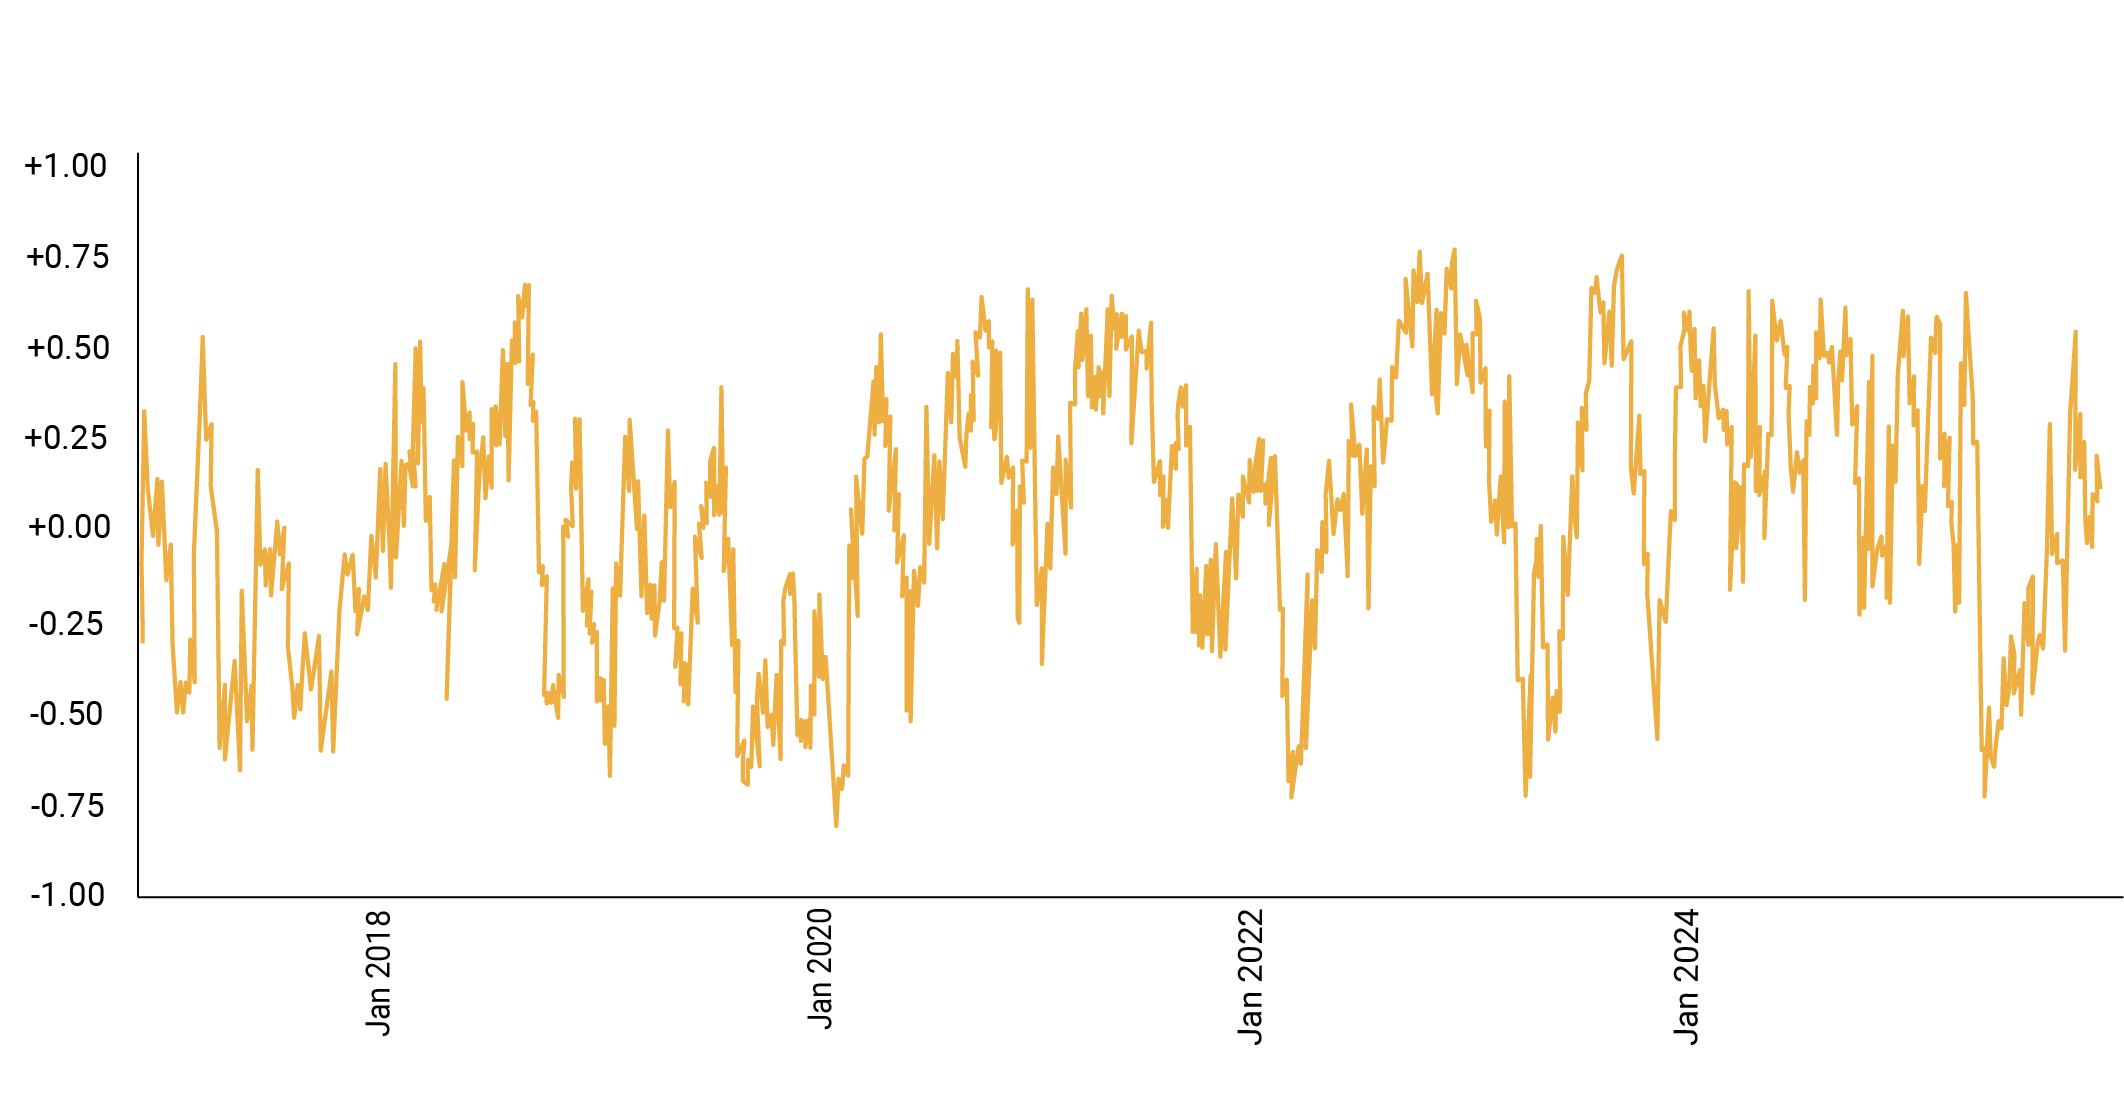
Chart Source: www.ETFreplay.com
While the recent rally is impressive, investors should consider how gold behaves relative to equities and its potential role in a diversified portfolio. Correlations between gold and equities have varied greatly. Over the past decade, the 20-day correlation between the S&P 500 and gold has swung from +0.76 to –0.81.10 A correlation of +0.76 means gold tended to rise when stocks rose, offering little diversification; a correlation of –0.81 means gold often moved in the opposite direction, providing strong diversification. Although the correlation generally remains below 1, there are long stretches when gold does not offset equity movements to the degree investors might expect.
Inflation protection is one of the strongest reasons investors buy gold. Because gold is priced in U.S. dollars, a weaker dollar usually lifts its value and makes it a useful inflation hedge. What is considered less often is the opposite scenario: a deflationary period in which the dollar strengthens. A stronger dollar raises the “denominator” of the gold price and can push gold lower just when investors expect it to rise. Deflation typically appears during downturns. In these periods, gold can fall alongside stocks. In 2008, gold dropped more than 25% before recovering, and in the early 2020 sell-off it also declined as investors raised cash.11 While inflation has dominated recent discussion, the risk of deflation, and the chance that gold could move down alongside equities, should not be overlooked.
In many ways, the frenzy surrounding gold in 2025 mirrors the allure of Mount Erebus itself. Gold captures attention because it is tangible, scarce, and steeped in history, yet it is important to remember what it is not. Gold does not produce earnings, pay dividends, or generate cash flow the way a business does. With limited exceptions, it only creates value for an investor when it is sold, which means its return depends entirely on someone else being willing to pay a higher price in the future. That does not make gold useless, but it does mean it functions very differently from productive assets. It serves as a reminder that while the pursuit of gold can spark imagination, sound investing requires careful footing. The Gold Rush 2025 may feel volcanic in scale, but navigating it wisely will matter far more than chasing every glimmer.
Sources:
[1,11] APMEX. “Gold Price.” www.apmex.com/gold-price
[2,6,7,8] World Gold Council. “Gold Demand Trends Q3 2025.” www.gold.org/goldhub/research/gold-demand-trends/gold-demand-trends-q3-2025
[3] World Gold Council. “Gold Production by Country.” www.gold.org/goldhub/data/gold-production-by-country
[4,5] World Gold Council. “How Much Gold.” www.gold.org/goldhub/data/how-much-gold
[9] Macrotrends LLC. “Historical Gold Prices: 100-Year Chart.” www.macrotrends.net/1333/historical-gold-prices-100-year-chart
[10] ETFreplay.com. “Correlation Tool.” www.etfreplay.com/correlation

v 2.4.161 | © One Day In July LLC. All Rights Reserved.


