The S&P 500 frequently trades near all-time highs, making it tempting to hold onto cash until prices drop. While caution is natural, waiting on the sidelines often leads to costly timing errors that can hinder long-term growth.
Below, we explore historical market data and key structural insights to help you look past short-term highs and build a more confident long-term investment strategy.
Whether you are trying to identify the exact peak or the absolute trough of a cycle, you are attempting to time the market. The reality is that no one can pinpoint these inflections with consistent, reliable accuracy. A market peak often looks like a ceiling right before the index climbs even higher, and a market dip appears stable right before a correction deepens.
Because short-term directional changes are fundamentally unpredictable, trying to wait for a dip often acts as a drag on performance. Procrastination and sitting on cash typically do more harm to long-term portfolio growth than investing at an apparent peak.1
For long-term investors, market history provides a comforting perspective. When viewed on a daily or weekly basis, a stock chart is a jagged line of volatile, visually jarring movements. However, the longer the timeframe you look at, the clearer the prevailing trend becomes.
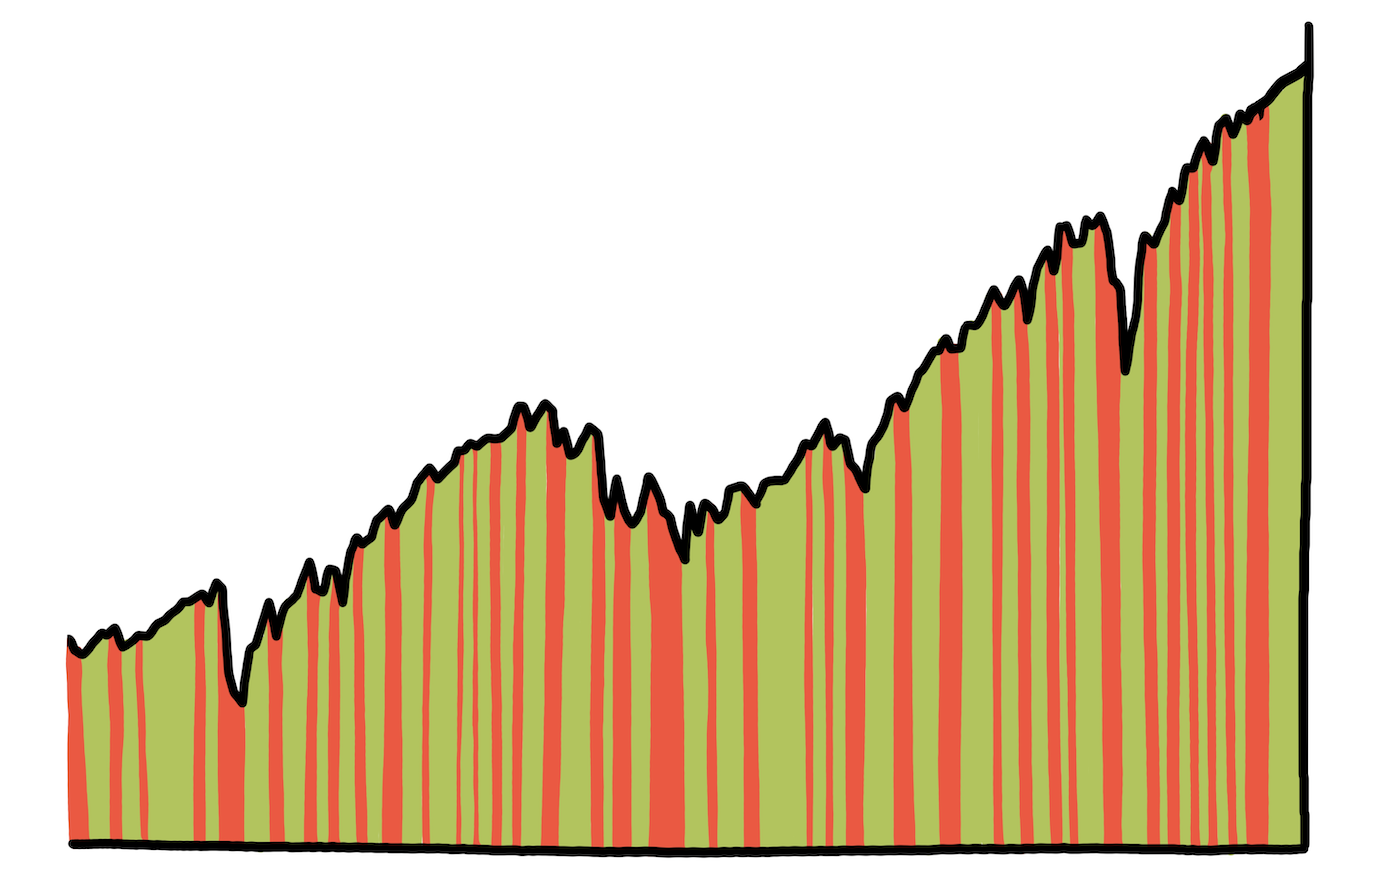
Consider a 20-year window from January 2006 through December 2025: despite enduring the Great Financial Crisis of 2008 and the pandemic shock of 2020, the S&P 500 posted an average annualized total return of approximately 11%.2 Even when factoring in the eroding effects of inflation, the real long-term trend remained robustly positive. Because corporate earnings and economic productivity expand over time, a healthy market is supposed to break new records regularly. An all-time high is a sign of a functioning growth engine, not an immediate warning of a crash.
If you have a long-term investment horizon, the historical data is clear: the sooner you get your assets exposed to the market, the better. Overthinking short-term fluctuations leads to analysis paralysis. If we accept that the broader equities market will continue its historical trajectory of compounding growth over time, then maximizing your "time in the market" is the most logical step. This gives your capital the maximum number of days, months, and years to benefit from the power of compounding.
Building wealth is about maintaining a disciplined, long-term view. For investors with the appropriate time horizon, understanding these market mechanics can provide comfort when deciding whether to invest today or wait for a drop. While aligning your portfolio with your personal goals and risk tolerance is essential, conquering the common psychological traps of market timing is equally critical.
1. Pasani, B. (November 8, 2023). Why market timing doesn’t work: S&P 500 is up 14% this year, but just 8 days explain the gains.CNBC. https://www.cnbc.com/2023/11/08/market-timing-doesnt-work-sp-500-14percent-rally-explained-by-just-8-days.html
2. Fidelity Investments. (December 2025). What is the S&P 500 and stock market average return? (Data tracking the 20-year rolling annualized total return from Jan 2006–Dec 2025 at 11.0%). https://www.fidelity.com/learning-center/trading-investing/sp-500-average-return

v 2.4.161 | © One Day In July LLC. All Rights Reserved.


