Europe vs the United States - an investor lesson

This graph says more than it seems:

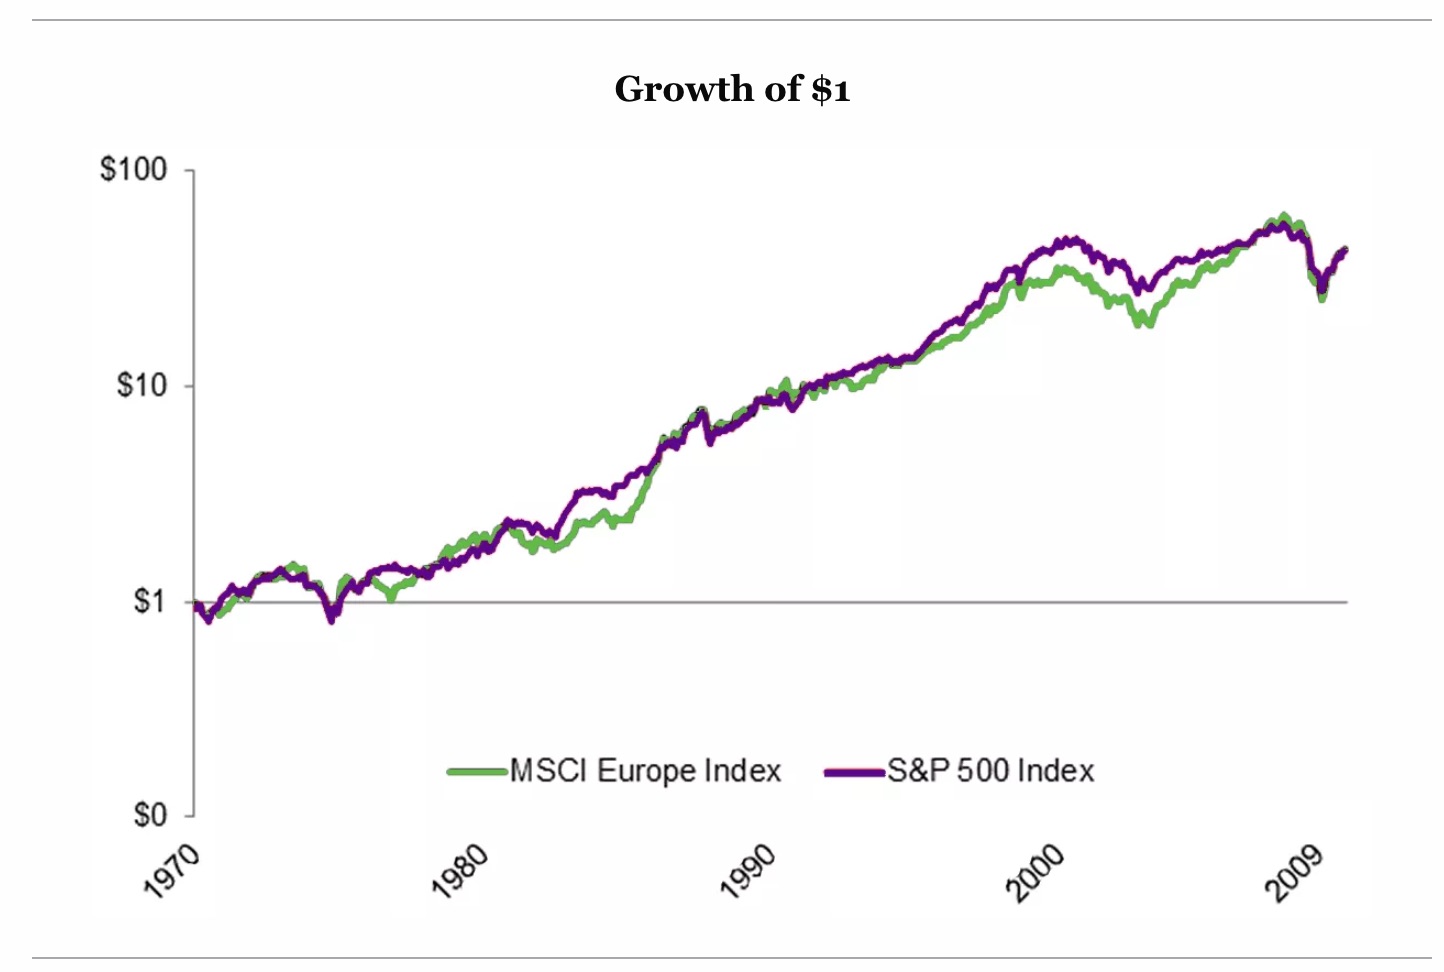
From 1970 through 2009, the performance of large European and large American corporations has been almost exactly the same. Actually, Europe beat us, at 9.88% vs 9.87%. (But we got John Lennon, so there.)

Note that the graph is logarithmic, so that divergence periods are large in percentage terms. And note that these divergence periods go on for long periods of time: 5 to 10 years. Not shown on this graph: currently we are in an extended stretch where American returns have exceeded those in Europe.

There are endless debates over who runs a better economic system: the U.S. or Europe. The United States has a labor market that is freer and more fluid. European CEOs' lower salaries leave more profit for investors. America has a better bankruptcy system to clean up non-performing assets, European workers get more vacation and are happier.

But over a 39 year period, it's fascinating that the two market systems had equivalent returns. Keep in mind that in any given year, the returns could diverge by 10% or more. And there have been several multi-year periods in that 39 years where the divergence exceeded 150%.

There is a gem at work here. Differing markets across geography or asset classes not only revert to their mean returns but also display the tendency to divert from that mean substantially at times. A good investment model should be able to use that to capture advantage both in returns and risk diversification.

That is a core underpinning idea of what we focus on at One Day In July.

Dan Cunningham

Sources: German CEO Compensation Fortune 4/4/14, CFA Institute 4/28/17

Return to Articles
DIFFERENTIATORS
GETTING STARTED
MATERIALS
How We Are Different
Understanding Your Financial Statement
Articles on Investing
Investing with Low Cost Index Funds
Pay Yourself First
Why Use a Fiduciary Financial Advisor?
Financial Planning
Quarterly Booklets
Simple, Low Investment Fees
Investor Resources
Investment Tools
Financial Firm Comparison
The Investment Process
One Day In July in the Media
Local Financial Advisor
How to Switch Financial Advisors
Frequently Asked Questions
Book Recommendations
Types of Investors
One Day In July Careers
Prospect Booklet
Square Mailers
Fee Calculator
SERVICES
Types of Accounts We Manage
Options for Self-Employed Retirement Plans
Saving Strategies
What to do When Receiving a Pension
Investment Tax Strategy: Tax Loss Harvesting
Vermont Investment Management
How to Invest an Inheritance
Investment Tax Strategy: Tax Lot Optimization
Vermont Retirement Planning
How to Make the Best 401k Selections
Investing for Retirement: 401k and More
Vermont Wealth Management
How to Rollover a 401k to an IRA
Investing in Bennington, VT
Vermont Financial Advisors
Investing in Albany, NY
Investing in Saratoga Springs, NY
INVESTING THOUGHTS
Should I Try to Time the Stock Market?
Mutual Funds vs. ETFs
Inflation
The Cycle of Investor Emotion
Countering Arguments Against Index Funds
Annuities - Why We Don't Sell Them
Aim for Average
How Financial Firms Bill
Low Investment Fees
Understanding Fixed Income: Interest Rate Risk
Investing in a Bear Market
Investing in Gold
Is Your Investment Advisor Worth One Percent?
Active vs. Passive Investment Management
Investment Risk vs. Investment Return
Who Supports Index Funds?
Articles by Dan Cunningham
Does Stock Picking Work?
The Growth and Importance of Female Investors
Behavioral Economics
The Forward P/E Ratio

Vergennes, VT Financial Advisor

206 Main Street Suite 20

Vergennes, VT 05491

(802) 777-9768

Wayne, PA Financial Advisor

851 Duportail Rd 2nd Floor

Chesterbrook, PA 19087

(610) 673-0074

Burlington, VT Financial Advisor

77 College Street #3A

Burlington, VT 05401

(802) 503-8280

Middlebury, VT Financial Advisor

79 Court Street, Suite 1,

Middlebury, VT 05753

(802) 829-6954

Hanover, NH Financial Advisor

26 South Main Street #4

Hanover, NH 03755

(802) 341-0188


v 2.4.48 | © One Day In July LLC. All Rights Reserved.